Project: nonlinear regression
One small experiment shows exactly what the activation changes: the shape of the function the model can learn.
The question
When does a linear layer stop being expressive enough for the pattern in the data?
What to remember
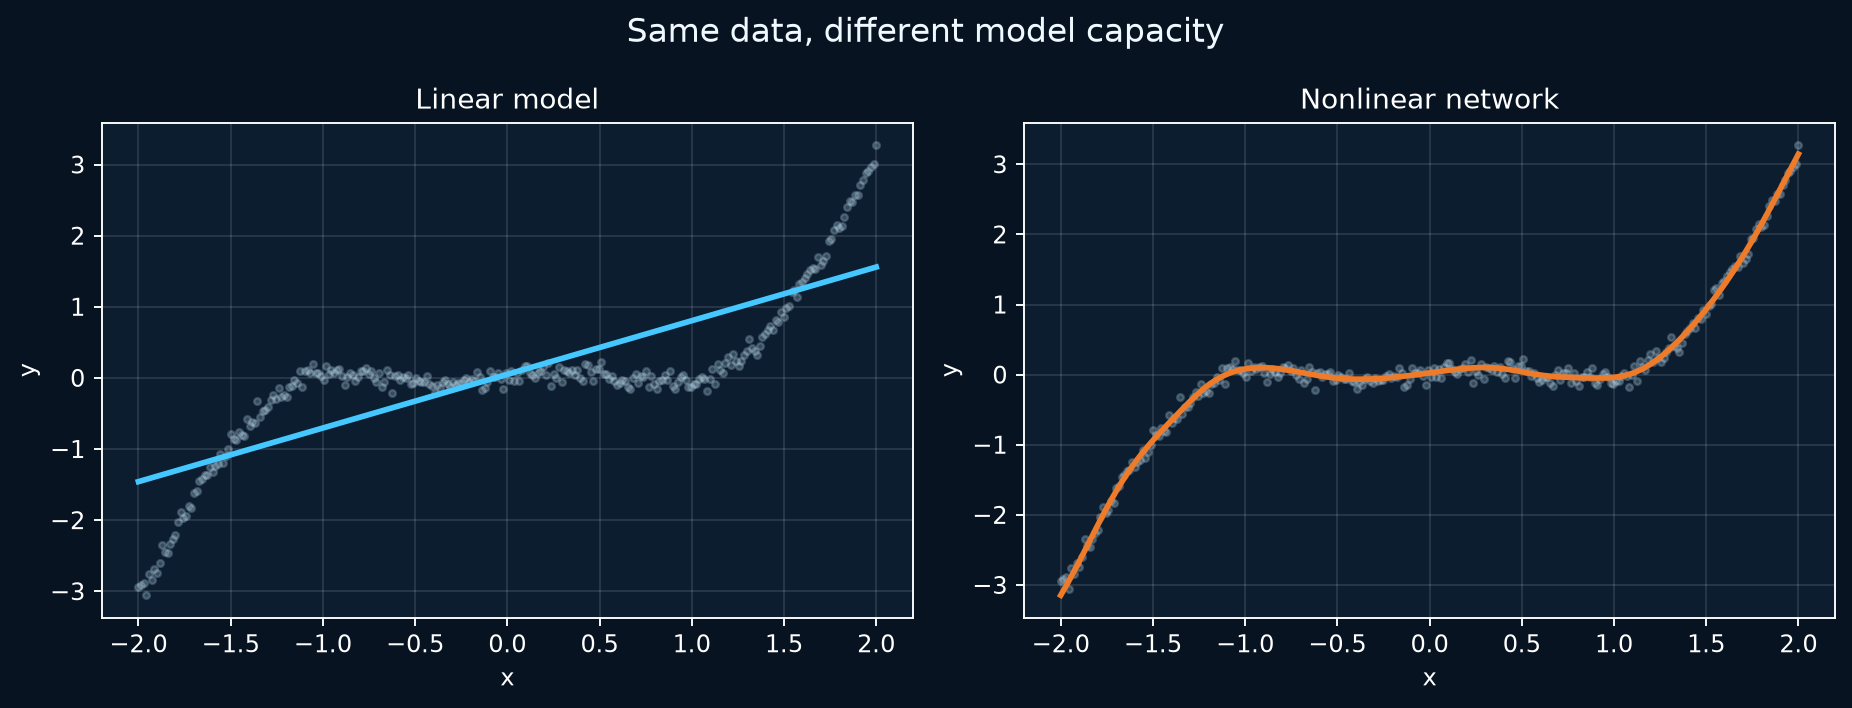
Several linear layers still describe one linear transformation unless an activation sits between them. Tanh lets this small network bend its prediction around a curved target.
Key code
linear = nn.Linear(1, 1)

nonlinear = nn.Sequential(
    nn.Linear(1, 32), nn.Tanh(),
    nn.Linear(32, 32), nn.Tanh(),
    nn.Linear(32, 1),
)
nn.Linear(1, 1) can only fit a line. The hidden layers create intermediate features; each Tanh makes the final mapping nonlinear.
Check yourself: remove both Tanh calls. The network has more parameters, but can it follow the curve? No: its layers still combine into one affine mapping. Compare this with the ReLU mini experiment: the exact activation differs, but the need for nonlinearity is the same.
Evidence and visual
This is a reproduced result from the retained script, using its synthetic dataset, seed 42, split, architecture, and training configuration. It is a capacity demonstration, not a general benchmark.
| Model | Validation MSE |
|---|---|
| Linear | 0.40296 |
| Nonlinear network | 0.00755 |
Interactive check
Changing width changes the number of learned hidden features. The important switch is still the activation: width without a nonlinear activation does not make a curved function possible.
Run it yourself
It prints the two validation losses and refreshes docs/assets/images/regression-comparison.png.
Complete source
Open the maintained runnable script
"""Compare linear and nonlinear regression on a deterministic synthetic curve."""

from __future__ import annotations

import json
from pathlib import Path

import matplotlib.pyplot as plt
import torch
from torch import nn


ROOT = Path(__file__).resolve().parents[1]
ARTIFACT_DIR = ROOT / "artifacts"
IMAGE_DIR = ROOT / "docs" / "assets" / "images"


def make_data(seed: int = 42) -> tuple[torch.Tensor, ...]:
    generator = torch.Generator().manual_seed(seed)
    x = torch.linspace(-2.0, 2.0, 280).unsqueeze(1)
    noise = 0.08 * torch.randn(x.shape, generator=generator)
    y = 0.45 * x.pow(3) - 0.35 * x + 0.2 * torch.sin(4 * x) + noise
    permutation = torch.randperm(len(x), generator=generator)
    train_indices = permutation[:220]
    validation_indices = permutation[220:]
    return x[train_indices], y[train_indices], x[validation_indices], y[validation_indices], x, y


def train(model: nn.Module, x: torch.Tensor, y: torch.Tensor, steps: int = 900) -> list[float]:
    optimizer = torch.optim.Adam(model.parameters(), lr=0.02)
    loss_fn = nn.MSELoss()
    history: list[float] = []
    for _ in range(steps):
        optimizer.zero_grad()
        loss = loss_fn(model(x), y)
        loss.backward()
        optimizer.step()
        history.append(float(loss.item()))
    return history


def run() -> dict[str, float]:
    torch.manual_seed(42)
    train_x, train_y, validation_x, validation_y, all_x, all_y = make_data()
    linear = nn.Linear(1, 1)
    nonlinear = nn.Sequential(
        nn.Linear(1, 32), nn.Tanh(),
        nn.Linear(32, 32), nn.Tanh(),
        nn.Linear(32, 1),
    )
    linear_history = train(linear, train_x, train_y)
    nonlinear_history = train(nonlinear, train_x, train_y)
    loss_fn = nn.MSELoss()
    with torch.no_grad():
        metrics = {
            "linear_validation_mse": float(loss_fn(linear(validation_x), validation_y)),
            "nonlinear_validation_mse": float(loss_fn(nonlinear(validation_x), validation_y)),
        }
        order = torch.argsort(all_x.squeeze(1))
        ordered_x = all_x[order]
        linear_prediction = linear(ordered_x)
        nonlinear_prediction = nonlinear(ordered_x)

    ARTIFACT_DIR.mkdir(exist_ok=True)
    IMAGE_DIR.mkdir(parents=True, exist_ok=True)
    (ARTIFACT_DIR / "regression_metrics.json").write_text(
        json.dumps(metrics, indent=2) + "\n", encoding="utf-8"
    )

    plt.style.use("dark_background")
    figure, axes = plt.subplots(1, 2, figsize=(11, 4.2))
    figure.patch.set_facecolor("#071321")
    for axis in axes:
        axis.set_facecolor("#0b1d2f")
        axis.scatter(all_x.numpy(), all_y.numpy(), s=8, alpha=0.25, color="#b8d7e9", label="samples")
        axis.grid(alpha=0.12)
        axis.set_xlabel("x")
        axis.set_ylabel("y")
    axes[0].plot(ordered_x.numpy(), linear_prediction.numpy(), color="#45c8ff", linewidth=2.4)
    axes[0].set_title("Linear model")
    axes[1].plot(ordered_x.numpy(), nonlinear_prediction.numpy(), color="#ee7b29", linewidth=2.4)
    axes[1].set_title("Nonlinear network")
    figure.suptitle("Same data, different model capacity", color="#eff9ff", fontsize=14)
    figure.tight_layout()
    figure.savefig(IMAGE_DIR / "regression-comparison.png", dpi=170, bbox_inches="tight")
    plt.close(figure)

    if metrics["nonlinear_validation_mse"] >= metrics["linear_validation_mse"]:
        raise AssertionError("The nonlinear model should fit the curved validation data better")
    if linear_history[-1] >= linear_history[0] or nonlinear_history[-1] >= nonlinear_history[0]:
        raise AssertionError("Training loss did not decrease")
    return metrics


if __name__ == "__main__":
    print(json.dumps(run(), indent=2))